Introduction
For equity investors, understanding the factors that drive a company’s growth is crucial to making informed decisions. One of the most insightful - yet often overlooked - indicators is headcount data.
As the investing landscape continues to evolve, there is an increasing amount of alternative data being captured, with
many firms beginning to leverage this data within their investing strategies. However, this trend of “
datafication” also comes with the combinatorial challenge of sifting through the noise to identify the most actionable signals for making investment decisions.
Headcount changes are not only a reflection of a company’s current operations but can also serve as a powerful predictor of
future revenue. This correlation, supported by work through our partners at
Cloud Ratings, reveals that shifts in workforce size often precede changes in revenue by several quarters, offering investors a glimpse into the future growth trajectory for certain types of companies.
The analysis below provides a closer look at the findings and methodology and provides investors with a powerful signal to help inform their investment strategy.
Understanding the Correlation Between PDL Headcount & Revenue
One of core results of the Cloud Ratings analysis was the strong relationship between headcount and revenue, which is demonstrated in the following figure:
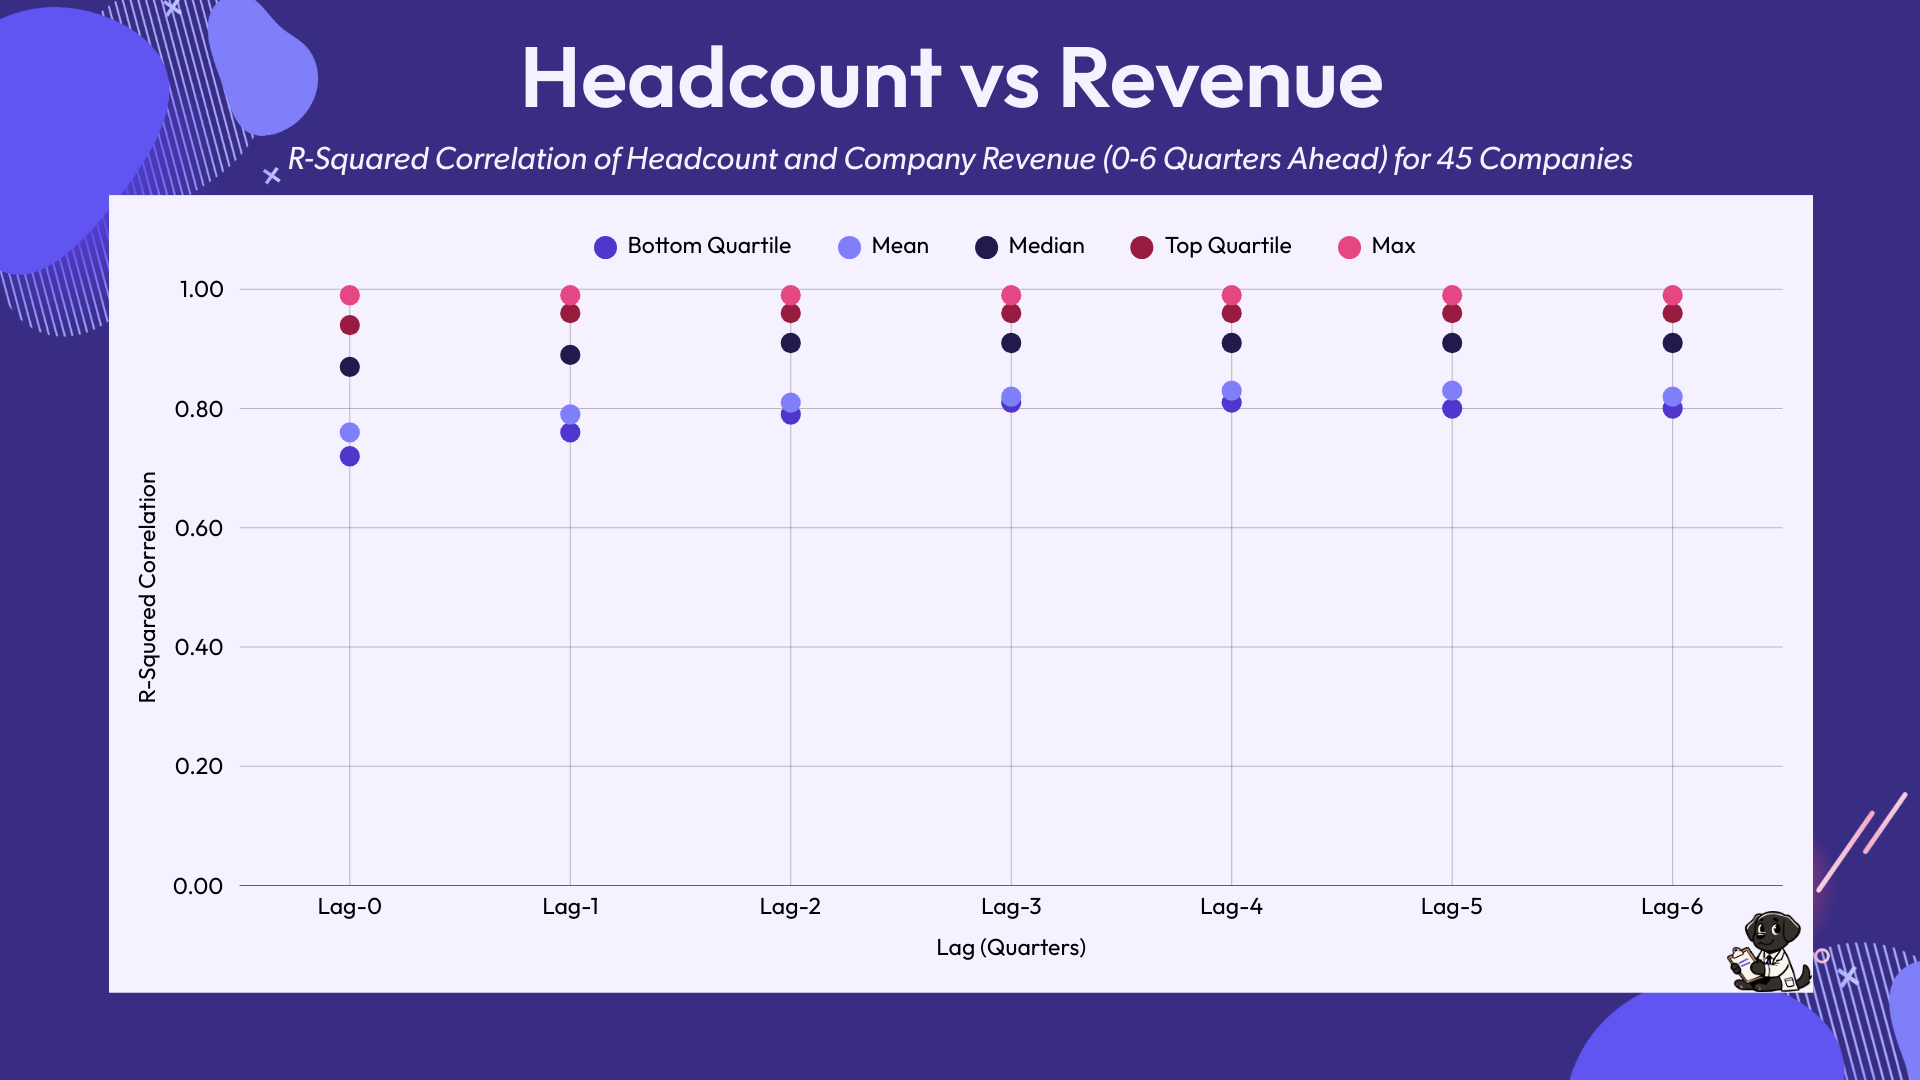
R-squared (R2) correlation between headcount and future revenue at 0 - 6 quarters out. Correlation was measured independently for a sample of 45 publicly traded software companies.
The figure above depicts the R-squared (R2) correlation between headcount and revenue, sampled across a collection of 45 publicly traded software companies. Correlations were measured across various lags (i.e. time intervals) to evaluate the forward-looking predictive power of headcount data in estimating future revenue performance. More details on the methodology and sample set are provided in the next section.
One of the most powerful takeaways from these results is how headcount can serve as a leading indicator of future revenue performance. Focusing on a couple points helps to illustrate this:
- Lag 0: median R2 = 0.87 (IQR: 0.22)
- Across the 45 sampled companies, headcount generally predicted around 87% of the variation in revenue for that same same quarter (Lag 0). The relatively strong R2 (and reasonably tight interquartile range), suggest that workforce size can serve as an immediate indicator of how a company is performing financially.
- Lag 6: median R2 = 0.91 (IQR: 0.16):
- Comparing headcount to revenue performance six quarters out (Lag 6) instead, yielded a stronger R2 correlation with headcount generally accounting for 91% of the variation in revenue performance 1.5 years later. This illustrates that R2 correlation remained very strong even in explaining future financial performance.
In other words, this figure demonstrates that the relationship between headcount and revenue is not just real-time; it can also help predict future revenue performance. This serves as a powerful argument for investors looking to leverage these signals to make more informed decisions about a company’s growth potential.
The Sample Set and Methodology
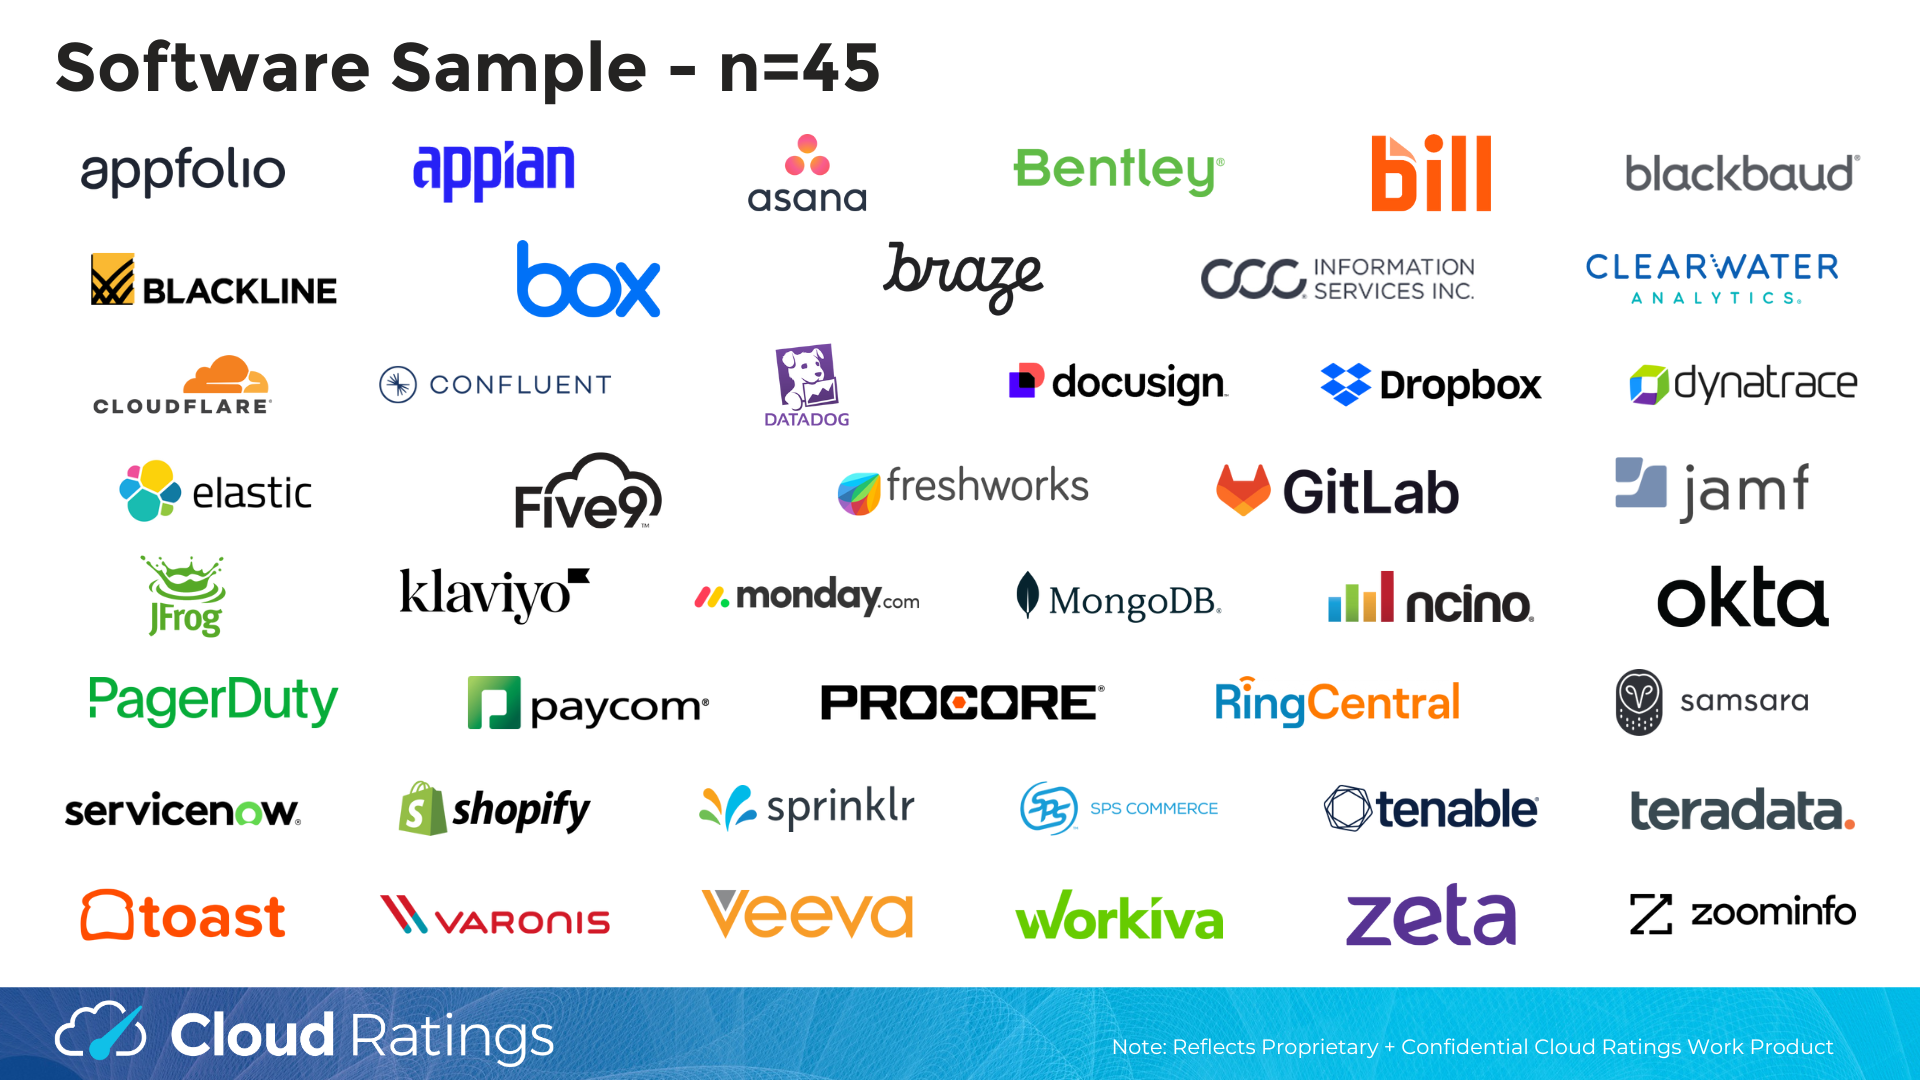
As mentioned previously, the findings presented above are based on a sample of 45 publicly traded SaaS companies, as shown in the figure below.
The set of 45 publicly traded SaaS companies used in this analysis.
For each company in the sample, the headcount of sales and marketing employees (using the People Data Labs role-specific
employee headcount breakdowns) were compared against the revenue performance at various lags (or time intervals), ranging from 0 to 6 quarters ahead.
The choice of SaaS companies for this study is particularly important as these types of companies tend to share certain properties (such as cost- and operational-structure along with specific revenue models) that make them particularly well-suited for this type of analysis:
- SaaS Company Characteristics: Saas companies often operate with scalable, recurring revenue models, and their growth is often tightly linked to their sales and marketing efforts. As a result, changes in headcount in these areas can be an especially strong indicator of future revenue performance.
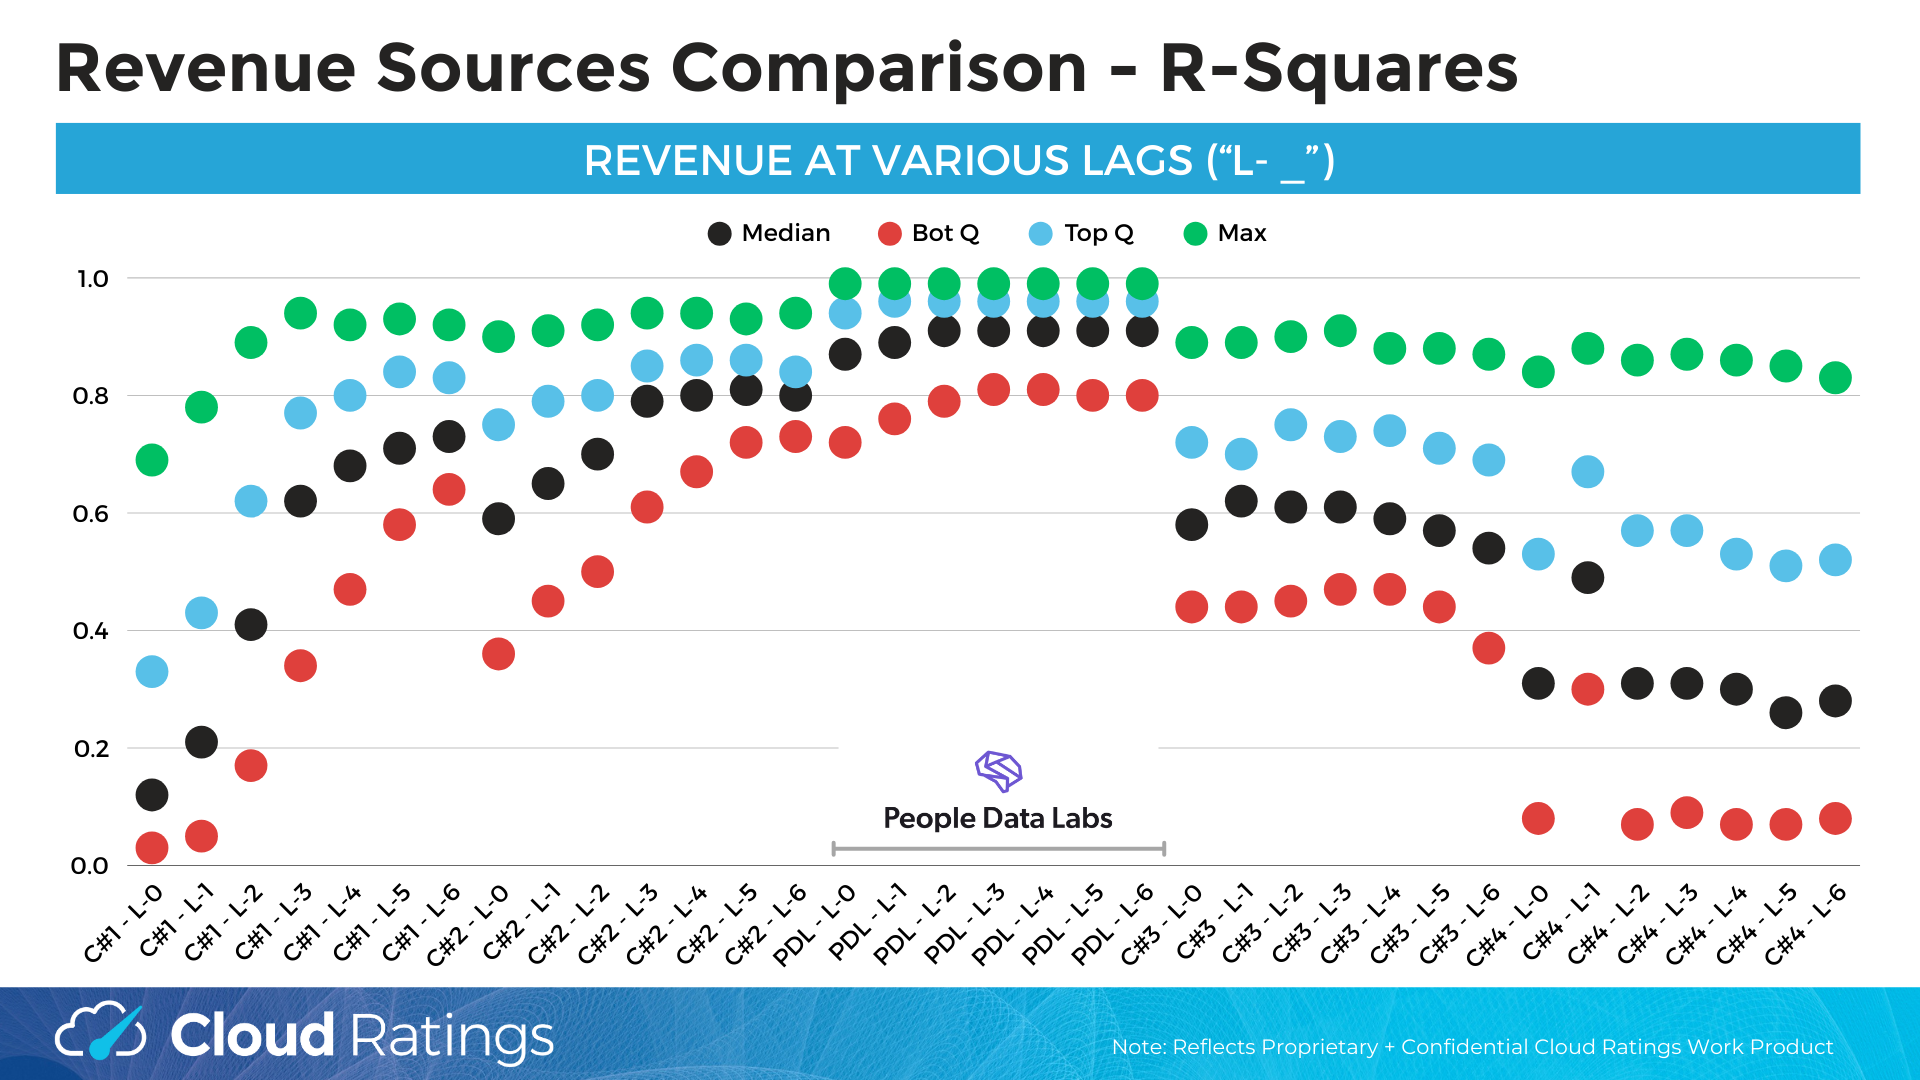
In addition to headcount data, the Cloud Ratings team ran the same lag-based correlation analysis on 4 other comparable (non-employment-based) alternative datasets. The results are shown in the figure below:
Results of the full suite of R2 lag-correlation tests run for headcount data (PDL) and 4 other comparable (non-headcount-based) alternative data sources (C1-C4). The lag intervals ranged from 0 quarters (L0) to 6 quarters (L6) out.
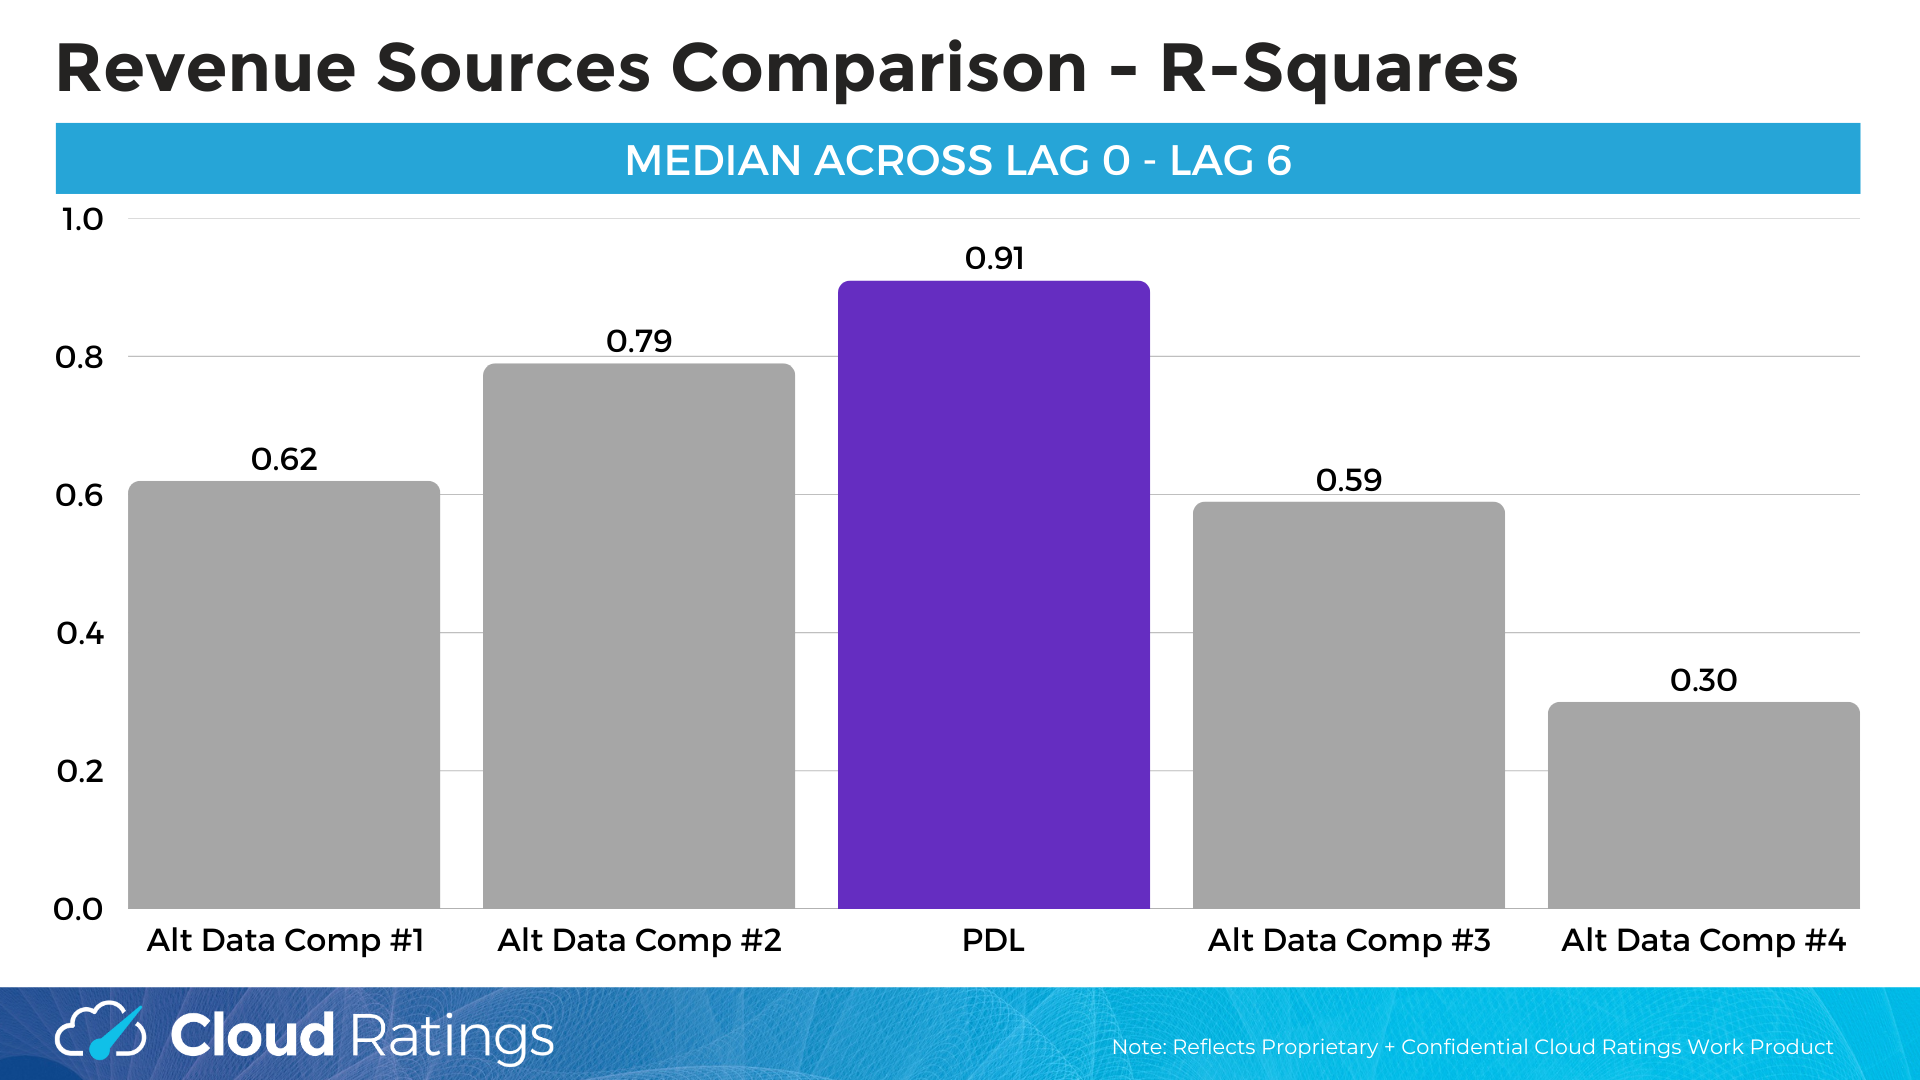
Median R2 correlation across all lags (Lag 0 - Lag 6), calculated for each of the 5 alternative data sources in the Cloud Ratings analysis. Headcount data is labeled as “PDL”.
What This Means for Investors
The results of this study demonstrate that headcount can serve as a valuable early signal of revenue changes:
- Early Signals for Growth and Private Equity Investors: Shifts in headcount can signal upcoming revenue trends, allowing investors to identify companies poised for growth or those facing potential challenges.
- Strategic Decision-Making: Leveraging headcount insights is particularly useful in due diligence and portfolio monitoring, allowing investors to better understand a company’s operational health and financial outlook. Moreover, headcount analytics offer investors competitive intelligence at the portfolio level, especially in tracking shifts within competitors’ sales teams.
- Sector-Specific Relevance: The correlation between headcount and revenue is especially powerful in certain industries, such as SaaS, tech and services-based businesses where workforce growth often directly correlates to scaling revenue.
However, while this study shows a strong correlation between headcount and revenue, there are still important caveats to keep in mind as well, as no signal metric should be used in isolation. Other factors, such as company maturity, industry-specific dynamics, market shifts, and overall economic conditions can often play a significant role in a company’s performance.
Next Steps
The analysis presented here provides a compelling case for the predictive power of headcount data. For a more detailed exploration of this study or other potential signals that can inform your investment strategies, we encourage you to
reach out to our partners at Cloud Ratings.
If you are interested in getting access to the same headcount data used in this study and building your own customized investment signals,
please reach out to us!

 Make a Privacy Request